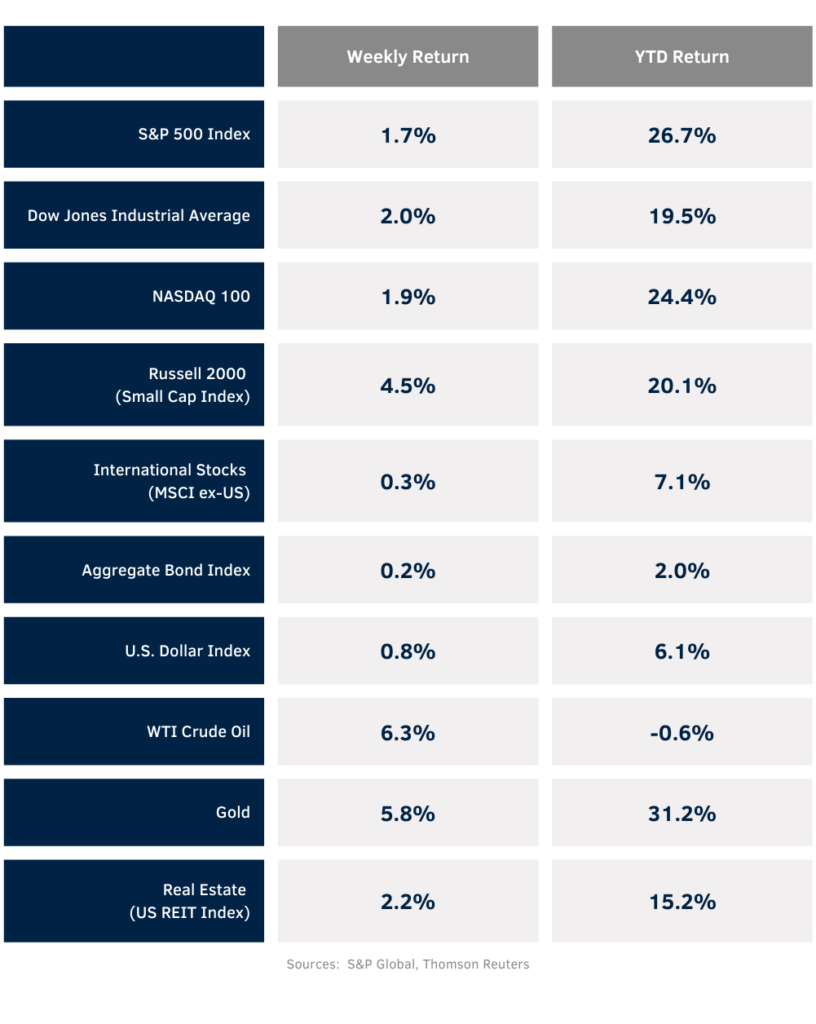
The equity markets regained their footing last week. For the week, the S&P 500 was +1.7%, the Dow Jones Industrials +2.0%, and the NASDAQ +1.9%. The Consumer Staples, Materials, and Utility sectors led the market, while the Communication Services, Consumer Discretionary, and Technology sectors lagged. The 10-year U.S. Treasury note yield decreased to 4.418% at Friday’s close versus 4.441% the previous week.
For the holiday shortened week, we will see the PCE Price Index report on Wednesday. Then, markets are closed for the Thanksgiving holiday on Thursday and will see an early close on Friday. Current CME Fed funds futures show a 0.25% reduction predicted for the FOMC meeting on December 18th. At that point, the Fed should issue an updated Summary of Economic Projections, providing a road map for the first quarter of 2025. Fed funds futures for the first quarter currently show a 0.25% reduction in interest rates.
We are 95% of the way through the third quarter earnings reporting period. Reports continues this week with nine companies in the S&P 500 Index scheduled to release results. Third quarter earnings growth is currently forecast at 5.8% year-over-year with revenue growth of 5.6%. Full-year 2024 earnings for the S&P 500 Index are expected to grow by 9.4% with revenue growth of 5.0%.
In our Dissecting Headlines section, we look at the cost of a Thanksgiving dinner.
Financial Market Update

Dissecting Headlines: Thanksgiving DinnerBased on data from the Farm Bureau, the cost of this year’s Thanksgiving dinner for 10 is $58.08, down 5.0% compared to last year. This is the second year that costs have receded from a record high of $64.05 in 2022, but dinner is still 19% higher than it was pre-pandemic in 2019.
Turkey, the meal’s largest component, has an average price of $25.67 for a 16-pound turkey, or $1.68 per pound. Turkey prices have declined 6.1% from 2023. For those opting for a different protein, boneless ham is 17.9% lower in price year-over-year.
Meal components that are also lower year-over-year include sweet potatoes which are 26.2% lower year-over-year, green peas are 8.0% lower, pumpkin pie mix is 6.5% lower, whipping cream is 4.6% lower, and pie crusts are 2.9% lower.
Meal components that are higher in cost year-over- year include fresh cranberries which are 11.9% higher year-over-year, dinner rolls are 8.3% higher, stuffing mix is 8.2% higher, and mixed vegetables are 6.7% higher.
