
The equity markets were mixed in the final week of August. For the week, the S&P 500 was +0.3%, the Dow was +1.1%, and the NASDAQ was -2.0%. Within the S&P 500 Index, the Financials, Industrials, and Materials sectors led the market, while the Technology, Communication Services, and Consumer Discretionary sectors lagged. The 10-year U.S. Treasury note yield increased to 3.918% at Friday’s close versus 3.804% the previous week.
The July Personal Consumption Expenditures (PCE) Price Index was +2.5% year-over-year and Core PCE was +2.6% year-over-year. This was inline with forecasts and supportive with the Federal Reserve’s current stance on inflation. Last week’s second estimate for second quarter Gross Domestic Product (GDP) saw an increase in growth to 3.0% from the 2.8% advance estimate released in July. One key reason for the increase was higher consumer spending (personal consumption expenditures) to 2.9% from 2.3% in the advance estimate. Spending on goods was 3.0% versus 2.5% and spending on services was 2.9% versus 2.2%.
The key data point for the upcoming week is the August Employment Situation Report scheduled for Friday. Current forecast is for 165,000 new jobs and an unemployment rate of 4.2%. Based on CME Fed funds futures, investors currently see a 0.25% reduction to the Fed funds target rate to a 5.00% to 5.25% range at the September Federal Open Market Committee (FOMC) meeting and a total of 1.00% in cumulative reductions by year-end.
Second quarter earnings ended with growth of 11.4% year-over-year on revenue growth of 5.3%. Looking ahead, third quarter earnings are currently forecast at 4.7% on revenue growth of 4.6%. Full-year 2024 earnings for the S&P 500 Index are expected to grow by 10.8% with revenue growth of 5.4%.
In our Dissecting Headlines section, we look at some historical and current perspective on September in the markets.
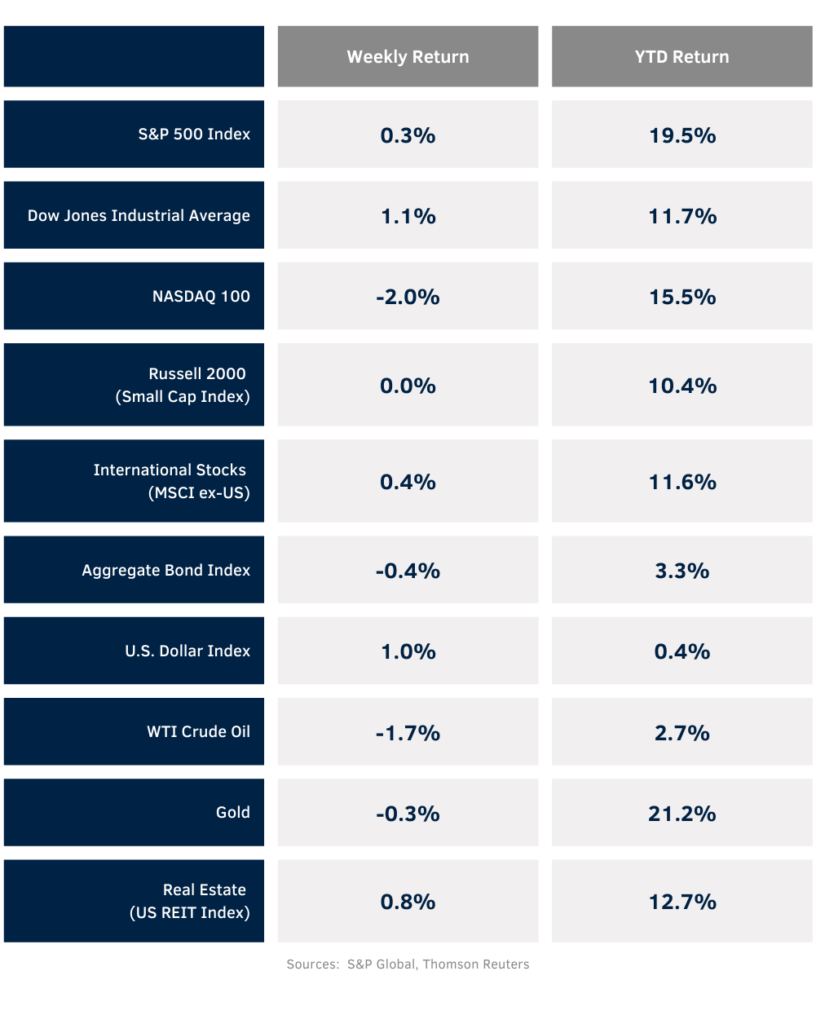
Financial Market Update
Dissecting Headlines: September
September has historically produced the lowest average monthly price returns for the S&P 500 Index since 1950. The average September price return (excludes dividends) is –0.7%. Reasons cited include a change in portfolio positions following late summer vacations, the start of tax loss harvesting, or quarterly rebalancing. In election years, October can also see weakness. The average return since 1950 for any given month is +0.7% with September the lowest and November the highest at +1.7%
But there is no need to run and hide. The fourth quarter of the calendar year (October through December) is historically the highest returning quarter of the year, with a +4.2% average return versus the first quarter at +2.1%, second quarter at +1.8%, and third quarter at +0.8%. Potential uncertainty heading into the election likely turns into certainty once the outcome for both the presidency and legislature in known. Additionally, with the FOMC in a position to begin lowering short-term interest rates, likely starting at its September meeting, the market could benefit from a soft landing scenario where interest rates decline but the economy avoids any severe downturn or recession.