
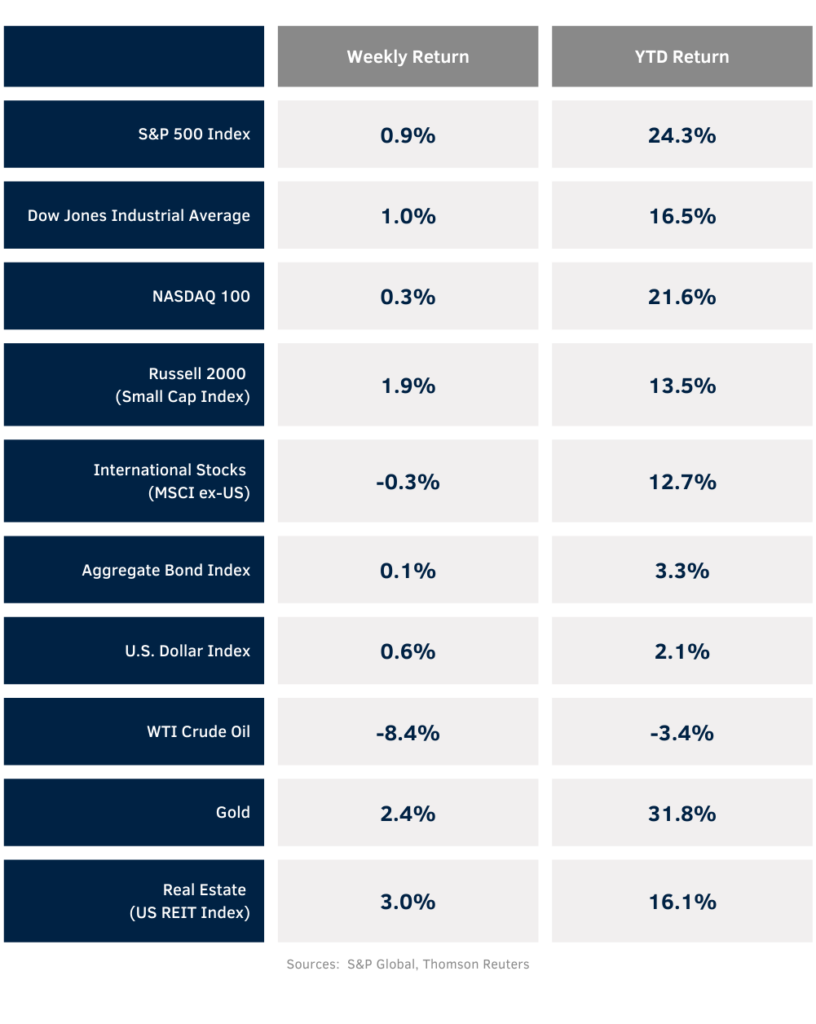
Equity markets completed a sixth straight winning week. For last week, the S&P 500 was +0.9%, the Dow +1.0%, and the NASDAQ +0.3%. Within the S&P 500 Index, the Utility, Real Estate, and Financial sectors led the market. The Energy, Health Care, and Communication Services sectors lagged. The 10-year U.S. Treasury note yield decreased to 4.078% at Friday’s close versus 4.084% the previous week.
Both the upcoming election and Federal Reserve policy meeting may help determine the market’s direction between now and year-end. Most national polls and prediction markets have the election very close with respect to both the presidency and control of both houses of Congress. The Fed meeting is two days after the election, so Fed members will have a complete picture of both the economy and political landscape before deciding on policy. Current CME Fed funds futures for November imply a 0.25% reduction in the Fed funds target rate at the meeting. An additional 0.25% in December would bring the year in at 100bps which is inline with the FOMC’s Summary of Economic Projections.
The third quarter earnings reporting period continues this week with 112 companies in the S&P 500 Index scheduled to report earnings. Third quarter earnings growth is currently forecast at 3.4% year-over-year with revenue growth of 4.7%. Full-year 2024 earnings for the S&P 500 Index are expected to grow by 9.4% with revenue growth of 5.0%.
In our Dissecting Headlines section, we look at what composition of government is best for investors.
Financial Market Update
Dissecting Headlines: Sweep or Split
With election day quickly approaching, we wanted to see what type of government is best for equity investors. Looking back to 1960, we looked at the composition of government for each year and the return of the S&P 500 Index. Since new government terms start in January, we used the whole year based on the composition of government for that year based on who was in power once the new President, House of Representatives, and Senate was sworn-in in January.
If we’re going to have a sweep with the same party winning the presidency and both houses of Congress, then history favors a Republican sweep with an average annual return of 13.0% versus 11.6% for a Democrat sweep. A Republican sweep also has a lower volatility band of results.
The best scenario historically is either a Democrat president with a Republican congress or a split congress (different parties controlling each part of the legislature), producing average annual returns of 18.5% and 18.1% respectively.
The worse scenario historically is a Republican president with the Democrats controlling both the Senate and House of Representatives with an average annual return of 6.2%.
The best single annual return for the measurement period was 37.6% with Democrat Bill Clinton as president and Republicans controlling both houses in 1995. The worst annual return for the period was -37.0% with Republican George W. Bush and Democrats controlling both houses in 2008. This was also the year of the global financial crisis.
The average annual return for any combination is positive. While different parties may bring different policies, the equity markets have proven resilient in spite of the government and elections.