
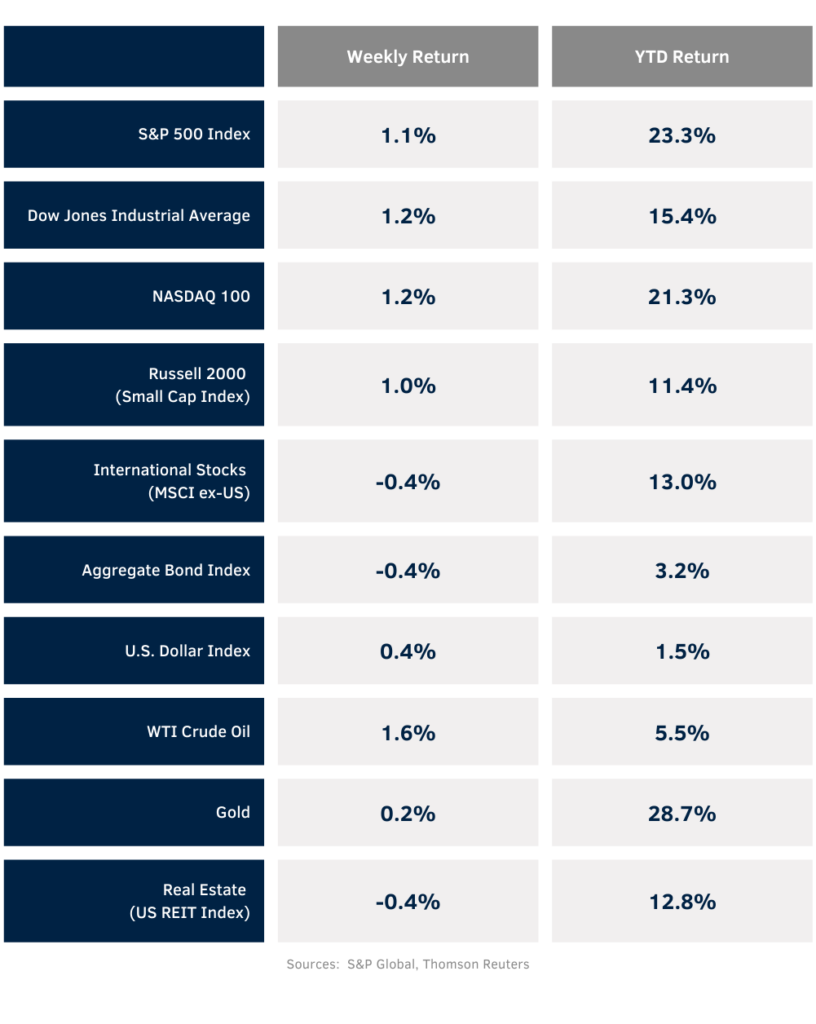
The next few weeks should give investors a lot to digest. The third quarter earnings season is in full swing, there is a hotly contested election in 22 days, and the next monetary policy decision from the Federal Reserve is two days after the election. For last week, optimism won out and U.S. equity markets closed higher with the S&P 500 +1.1%, the Dow +1.2%, and the NASDAQ +1.2%. Within the S&P 500 Index, the Technology, Industrial, and Financial sectors led the market. The Utility, Communication Services, and Consumer Discretionary sectors lagged. The 10-year U.S. Treasury note yield increased to 4.084% at Friday’s close versus 3.976% the previous week.
Inflation reports were relatively in line with the September Consumer Price Index (CPI) +0.2% month-over-month and +2.4% year-over-year, and core CPI, which excludes food and energy prices, +0.3% month-over-month and +3.3% year-over-year. Wholesale inflation, as measured by the Producer Price Index (PPI), was flat versus August and +1.8% year-over-year, and core PPI was +0.1% month-over-month and +3.2% year-over-year. Based on CME fed funds futures, the market is anticipating a total of 0.50% reduction in the fed funds rate between now and year-end.
The third quarter earnings reporting period continues this week with 43 companies in the S&P 500 Index scheduled to report earnings. Third quarter earnings growth is currently forecast at 4.1% year-over-year with revenue growth of 4.6%. Full-year 2024 earnings for the S&P 500 Index are expected to grow by 9.7% with revenue growth of 5.0%.
In our Dissecting Headlines section, we look at Halloween spending trends.
Financial Market Update
Dissecting Headlines: Halloween
Consumers have been fighting inflation by reducing spending on some discretionary items. Halloween is not immune and some modest reductions in spending are forecast for the holiday. Based on data from the National Retail Federation, total Halloween spending is expected to be $11.6 billion, 4.9% lower than 2023. Shopping in 2023 was 15.0% higher than 2022 as the impact of the pandemic continued to wain. As a comparison, total Halloween spending was $8.0 billion in 2020.
Across spending categories, candy spending is expected to reach $3.5 billion, down modestly from $3.6 billion in 2023. Total spending on decorations is expected to be $3.8 billion, followed by costumes at $3.8 billion, and greeting cards at $0.5 billion. Within costumes, total spending on adult costumes is expected to be $1.8 billion, children’s costumes is anticipated to be $1.3 billion, and pet costumes is expected to be $0.7 billion.
At retail, discount stores are the top destination for Halloween items with approximately 37% survey respondents saying they plan to shop there, followed by specialty Halloween and costume stores at 33%, and online shopping at 33%. Most survey respondents shop at more than one option.
Average pumpkin prices are expected to be $5.47, which is 4.4% higher than 2023.