
The market bounced back last week on generally upbeat earnings reports across several sectors. For the week, the S&P 500 Index was +2.4%, the Dow Jones Industrials +1.4%, and the NASDAQ +3.7%. The Technology, Consumer Discretionary, and Communication Services sectors led the S&P 500 Index for the week, while the Energy, Health Care, and Real Estate sectors lagged. The 10-year U.S. Treasury note yield increased to 4.275% at Friday’s close versus 4.214% the previous week.
Last week’s focus was more on corporate earnings and less on macroeconomics and trade. One hundred twenty-two companies in the S&P 500 Index reported earnings last week and the earnings reporting period is now 90% complete. This week, the focus shifts back to economics with a look at inflation via the July Consumer Price Index (CPI) and Producer Price Index (PPI) reports and July retail sales. With employment weakening and concerns around the impact of tariffs impacting the consumer psyche, the health of the consumer is a key component to maintaining economic growth. This is all data that the Federal Reserve can consider as its moves toward a potential easing of monetary policy in the months ahead.
We shouldn’t hear any major monetary policy news until the Fed’s Jackson Hole Economic Symposium later in August. Currently, CME Fed funds futures have shifted back to forecasting a total of 0.50% in rate cuts between now and year-end, versus 0.75% last week. The first 0.25% rate cut is still expected at the September meeting.
We are heading into the tail-end of the second quarter earnings reporting period. This week, eight companies in the S&P 500 Index are scheduled to report earnings. Of the 90% of companies that have reported so far, 81% have reported upside results versus consensus expectations. This has increased S&P 500 Index earnings growth expectations for the quarter to 11.8% from 4.8% at the start of the reporting period, and revenue growth to 6.3% from 4.2%. Full-year 2025 earnings are expected to grow by 10.3% with revenue growth of 5.8%.
In our Dissecting Headlines section, we look at the CNN Fear & Greed Index.
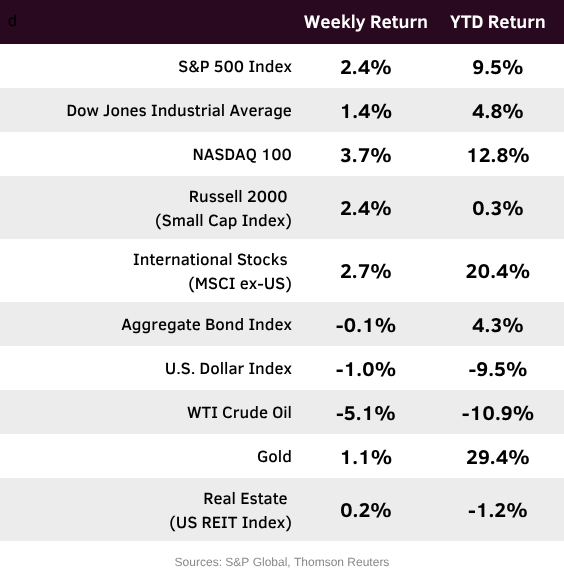
Financial Market Update
Dissecting Headlines: Measuring Fear & Greed
CNN publishes a Fear & Greed Index which can be a useful tool to gauge stock market movements and measure investor sentiment. Periods of excessive fear tends to drive down share prices, and too much greed tends to have the opposite effect.
The index compiles seven different indicators that measure stock market behavior: market momentum, stock price strength, stock price breadth, put and call options, junk bond demand, market volatility, and safe haven demand. The index tracks how much these individual indicators deviate from their averages compared to how much they normally diverge. The index gives each indicator equal weighting in calculating a score from 0 to 100, with 100 representing maximum greediness and 0 signaling maximum fear.
Last week ended with the Index at 59, indicating a modest level of Greed. Market Momentum was in the Greed zone as the S&P 500 is currently above its 125-day moving average. Stock Price Strength is also at Greed with net new 52-week highs on the NYSE a positive. Stock price breadth, Put/Call Option ratios, and market volatility are all at Neutral readings. Junk Bond Demand is at Extreme Greed as the spread between lower quality bonds and investment grade bonds is at a low. Safe Haven Demand is at a Greed reading as stocks have outperformed bonds over the past 2-days.
Understanding the individual components of the Index can make it another useful tool to monitor the markets.