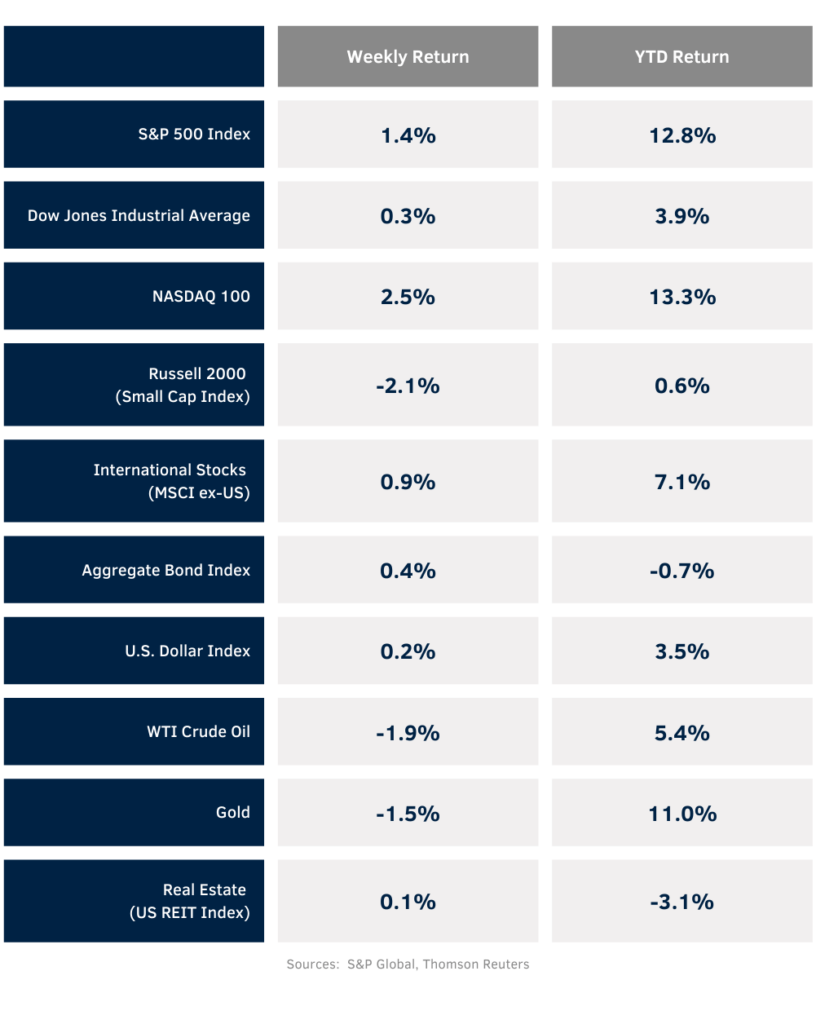
Markets absorbed strong employment data and finished higher last week. For the week, the S&P 500 Index was +1.4%, the Dow was +0.3%, and the NASDAQ was +2.5%. Within the S&P 500 Index, the Technology, Health Care, and Communication Services sectors led, while the Utility, Energy, and Materials sectors lagged. The 10-year U.S. Treasury note yield decreased to 4.431% at Friday’s close versus 4.486% the previous week.
A resilient labor market may be calling into question if the Federal Reserve has any need to lower interest rates this year. The May Employment Situation Report showed 272,000 net new jobs created versus an expectation of 185,000. This labor market strength has potentially pushed out expectations for an initial Federal Reserve rate cut beyond September. Based on CME Fed funds futures, the probability of a September rate cut is now at a near even 51.0%. Significant data this week should be the updated Summary of Economic Projections by the Federal Open Market Committee (FOMC) at the conclusion of its meeting on Wednesday. Prior to the meeting, the May Consumer Price Index (CPI) is scheduled for release.
With over 99% of companies in the S&P 500 Index complete on first quarter earnings reports, year-over-year earnings growth for the quarter should finish around 5.9% with revenue growth of 4.2%. For the coming week, one company in the S&P 500 Index is scheduled to report first quarter earnings and the first two companies of the second quarter are scheduled to report earnings as well. Looking ahead to the second quarter, earnings growth is expected to accelerate to 9.2% year-over-year with revenue growth of 4.7%. Full-year 2024 earnings for the S&P 500 Index are expected to grow by 11.3% with revenue growth of 5.0%.
In our Dissecting Headlines section, we look at the two reports that measure the labor market each month.
Financial Market Update
Dissecting Headlines: Job Count
Last Wednesday, the ADP National Employment Report showed 152,000 jobs created in May versus an expectation of 175,000. A cooling labor market would increase the possibility of an FOMC rate cut over the next few months and made investors optimistic. On Friday, the Bureau of Labor Statistic’s (BLS) May Employment Situation report showed 272,000 jobs created versus an expectation of 185,000. This dampened the expectations of a cooling labor market that was felt just two days earlier. Why the difference?
The ADP report is based on data from Automatic Data Processing (ADP) and its payroll clients. The report is produced by the ADP Research Institute in collaboration with the Stanford Digital Economy Lab. ADP handles payroll for approximately 20% of all privately employed workers. It does not track farm workers and does not track government workers. The BLS report covers all nonfarm payrolls, both private and government, by surveying employers which account for approximately one-third of all nonfarm payroll jobs in the United States. The ADP report is based on the data of ADP’s client companies, so it must extrapolate to create a national employment number, but it also has control of collecting data since it runs payroll for those companies, whereas the BLS need to rely on responses to its survey. Lastly, ADP’s clients are generally larger companies. Companies with less than 20 employees and self-employed individuals may not use a large payroll provider like ADP, so the numbers may skew toward what is happening with larger employers.
Historically, the two reports align with a correlation above 70%. Since the ADP report is released two days before the BLS report each month, investors will act on the first available data. This can also cause it to frame expectation for the BLS report a few days later. When the reports don’t show the same magnitude of results versus expectations, investors may get whipsawed over the course of those few days, especially if they are making short-term bets based on marginal results versus expectations rather than absorbing both reports as indicators of the state of the labor market.
This material has been prepared for informational purposes only and is not intended to provide, and should not be relied upon for, tax, legal or accounting advice.
Fidelity Investments is an independent company, unaffiliated with GENCapital. There is no form of legal partnership, agency affiliation, or similar relationship between your financial advisor and Fidelity Investments, nor is such a relationship created or implied by the information herein. Fidelity Investments has not been involved with the preparation of the content supplied in the GENCapital site and does not guarantee or assume any responsibility for its content.
Rate Debate
Markets absorbed strong employment data and finished higher last week. For the week, the S&P 500 Index was +1.4%, the Dow was +0.3%, and the NASDAQ was +2.5%. Within the S&P 500 Index, the Technology, Health Care, and Communication Services sectors led, while the Utility, Energy, and Materials sectors lagged. The 10-year U.S. Treasury note yield decreased to 4.431% at Friday’s close versus 4.486% the previous week.
A resilient labor market may be calling into question if the Federal Reserve has any need to lower interest rates this year. The May Employment Situation Report showed 272,000 net new jobs created versus an expectation of 185,000. This labor market strength has potentially pushed out expectations for an initial Federal Reserve rate cut beyond September. Based on CME Fed funds futures, the probability of a September rate cut is now at a near even 51.0%. Significant data this week should be the updated Summary of Economic Projections by the Federal Open Market Committee (FOMC) at the conclusion of its meeting on Wednesday. Prior to the meeting, the May Consumer Price Index (CPI) is scheduled for release.
With over 99% of companies in the S&P 500 Index complete on first quarter earnings reports, year-over-year earnings growth for the quarter should finish around 5.9% with revenue growth of 4.2%. For the coming week, one company in the S&P 500 Index is scheduled to report first quarter earnings and the first two companies of the second quarter are scheduled to report earnings as well. Looking ahead to the second quarter, earnings growth is expected to accelerate to 9.2% year-over-year with revenue growth of 4.7%. Full-year 2024 earnings for the S&P 500 Index are expected to grow by 11.3% with revenue growth of 5.0%.
In our Dissecting Headlines section, we look at the two reports that measure the labor market each month.
Financial Market Update
Dissecting Headlines: Job Count
Last Wednesday, the ADP National Employment Report showed 152,000 jobs created in May versus an expectation of 175,000. A cooling labor market would increase the possibility of an FOMC rate cut over the next few months and made investors optimistic. On Friday, the Bureau of Labor Statistic’s (BLS) May Employment Situation report showed 272,000 jobs created versus an expectation of 185,000. This dampened the expectations of a cooling labor market that was felt just two days earlier. Why the difference?
The ADP report is based on data from Automatic Data Processing (ADP) and its payroll clients. The report is produced by the ADP Research Institute in collaboration with the Stanford Digital Economy Lab. ADP handles payroll for approximately 20% of all privately employed workers. It does not track farm workers and does not track government workers. The BLS report covers all nonfarm payrolls, both private and government, by surveying employers which account for approximately one-third of all nonfarm payroll jobs in the United States. The ADP report is based on the data of ADP’s client companies, so it must extrapolate to create a national employment number, but it also has control of collecting data since it runs payroll for those companies, whereas the BLS need to rely on responses to its survey. Lastly, ADP’s clients are generally larger companies. Companies with less than 20 employees and self-employed individuals may not use a large payroll provider like ADP, so the numbers may skew toward what is happening with larger employers.
Historically, the two reports align with a correlation above 70%. Since the ADP report is released two days before the BLS report each month, investors will act on the first available data. This can also cause it to frame expectation for the BLS report a few days later. When the reports don’t show the same magnitude of results versus expectations, investors may get whipsawed over the course of those few days, especially if they are making short-term bets based on marginal results versus expectations rather than absorbing both reports as indicators of the state of the labor market.
This material has been prepared for informational purposes only and is not intended to provide, and should not be relied upon for, tax, legal or accounting advice.